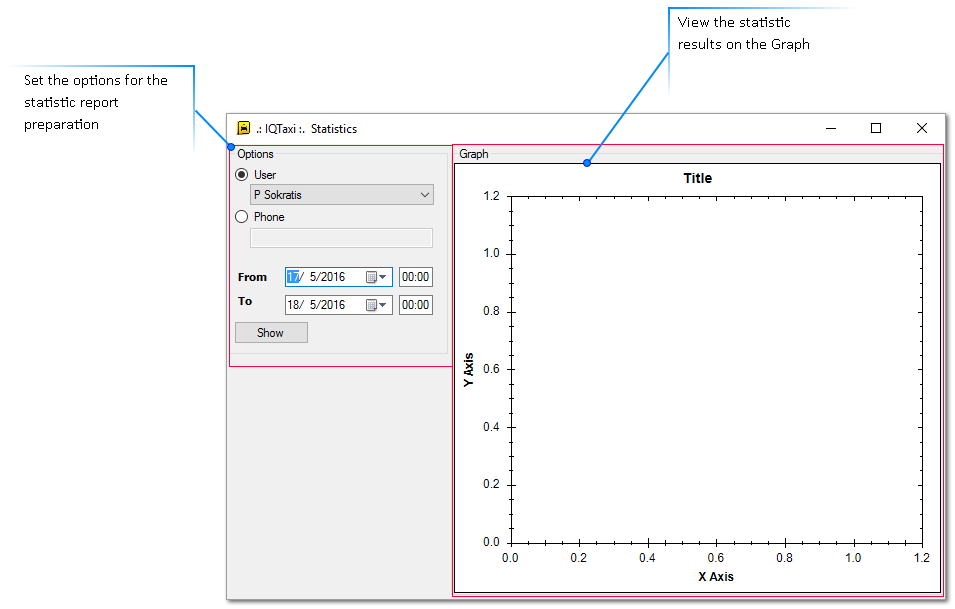
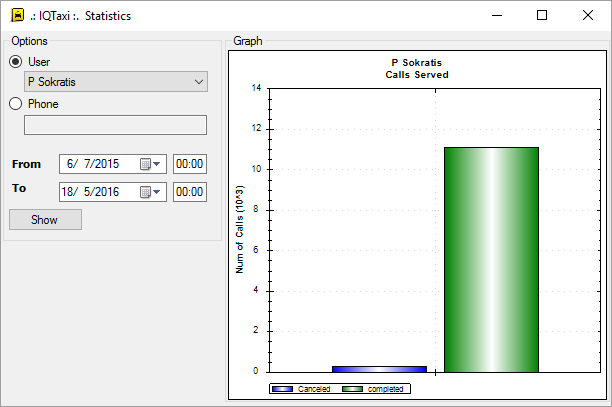
The Statistics Form allows you to prepare statistics reports regarding the call service of each call center user during a specific period. The form contains a graph frame where are visualized the statistic results based on each report request. You can request a call service report to compare the completed and canceled calls of each register user at a particular time period.

 How to prepare a statistic graphTo prepare a statistic graph you have simply follow the steps below.
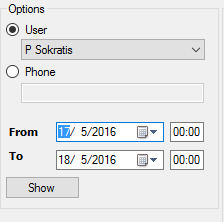
1. Go to Options session and select the User or the Phone station you want to request for data, by clicking on the corresponding check box
2. If you choose the User check box, the dropdown list under it becomes active and opens a predefine list with the registered user to select the one you prefer. If you choose the Phone check box you have to type on the empty box under it the phone number of a specific work station.
3. Give the data period you are interesting in, by typing or selecting from the calendars the date and time of the first and last day of this period (From and To boxes).
4. Click on the Show button to view the graph of your requested data.
The graph compares the amount of the canceled and completed calls of the specific user at the selected period of time.
|


